One of the worst moments to think clearly about a market is right after it has made an extreme move.
That is usually when opinions become loudest, confidence becomes least reliable, and people start projecting too much meaning onto the last move.
After a sharp rally, the market is suddenly treated as either a rocket ship or a blow-off top.
After a sharp selloff, it becomes either generational value or the start of something much worse.
The framing is emotionally satisfying because it gives people a clean binary. Long or short. Breakout or collapse. Chase or fade.
But historically, markets are often less dramatic than that.
A large move does not automatically imply continuation. It also does not automatically imply reversal. Many times, the market needs to digest what just happened.
That digestion can look like drift. It can look like chop. It can look like a shallow pullback before continuation, or a frustrating grind higher that never gives the clean entry people are waiting for.
The point is simple:
Volatility is information, but it is not direction.

This is where historical context becomes useful.
Not because analogs can tell the future with certainty. They cannot.
But because they can force a more disciplined question:
What usually happened after similar structures?
That question matters most when the market feels obvious, because "obvious" is often just emotion wearing a better suit.
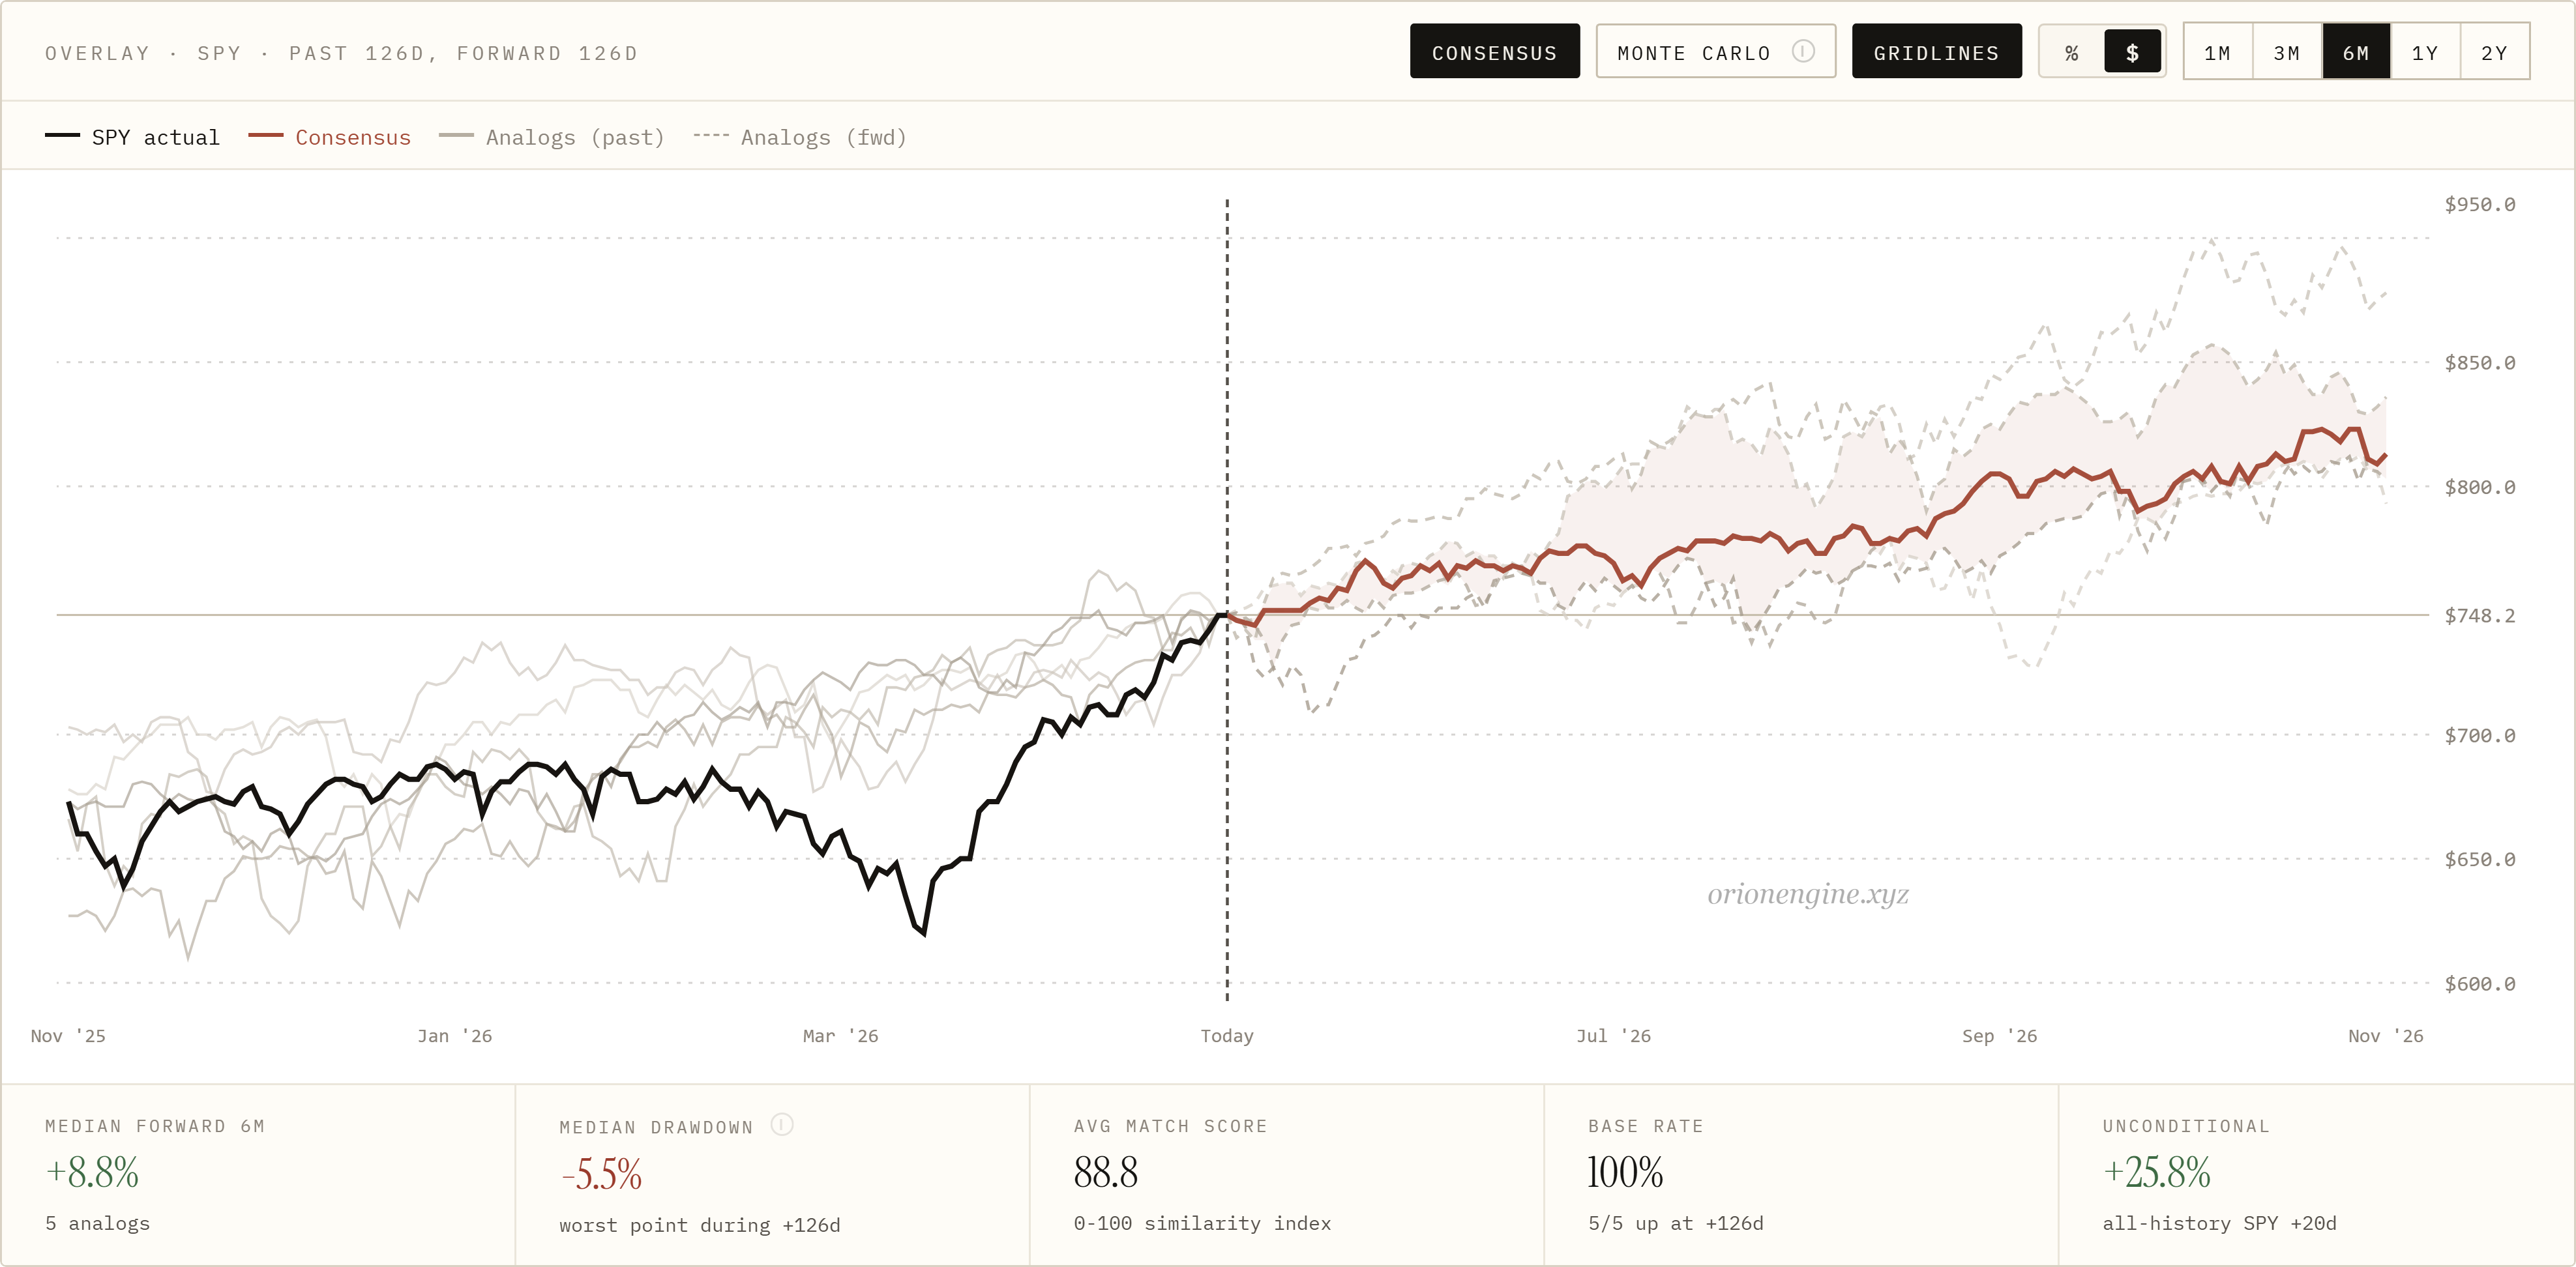
SPY is a good example.
After a strong recovery, people naturally split into familiar camps. Some extrapolate the move higher. Others assume the market has gone too far and must correct.
But the historical analogs do not necessarily support the clean emotional binary. The forward paths can be positive without being euphoric, constructive without being vertical, and still include enough drawdown to punish anyone who enters with too much conviction.
That is the part people miss.
A bullish historical tendency does not mean the path is comfortable.
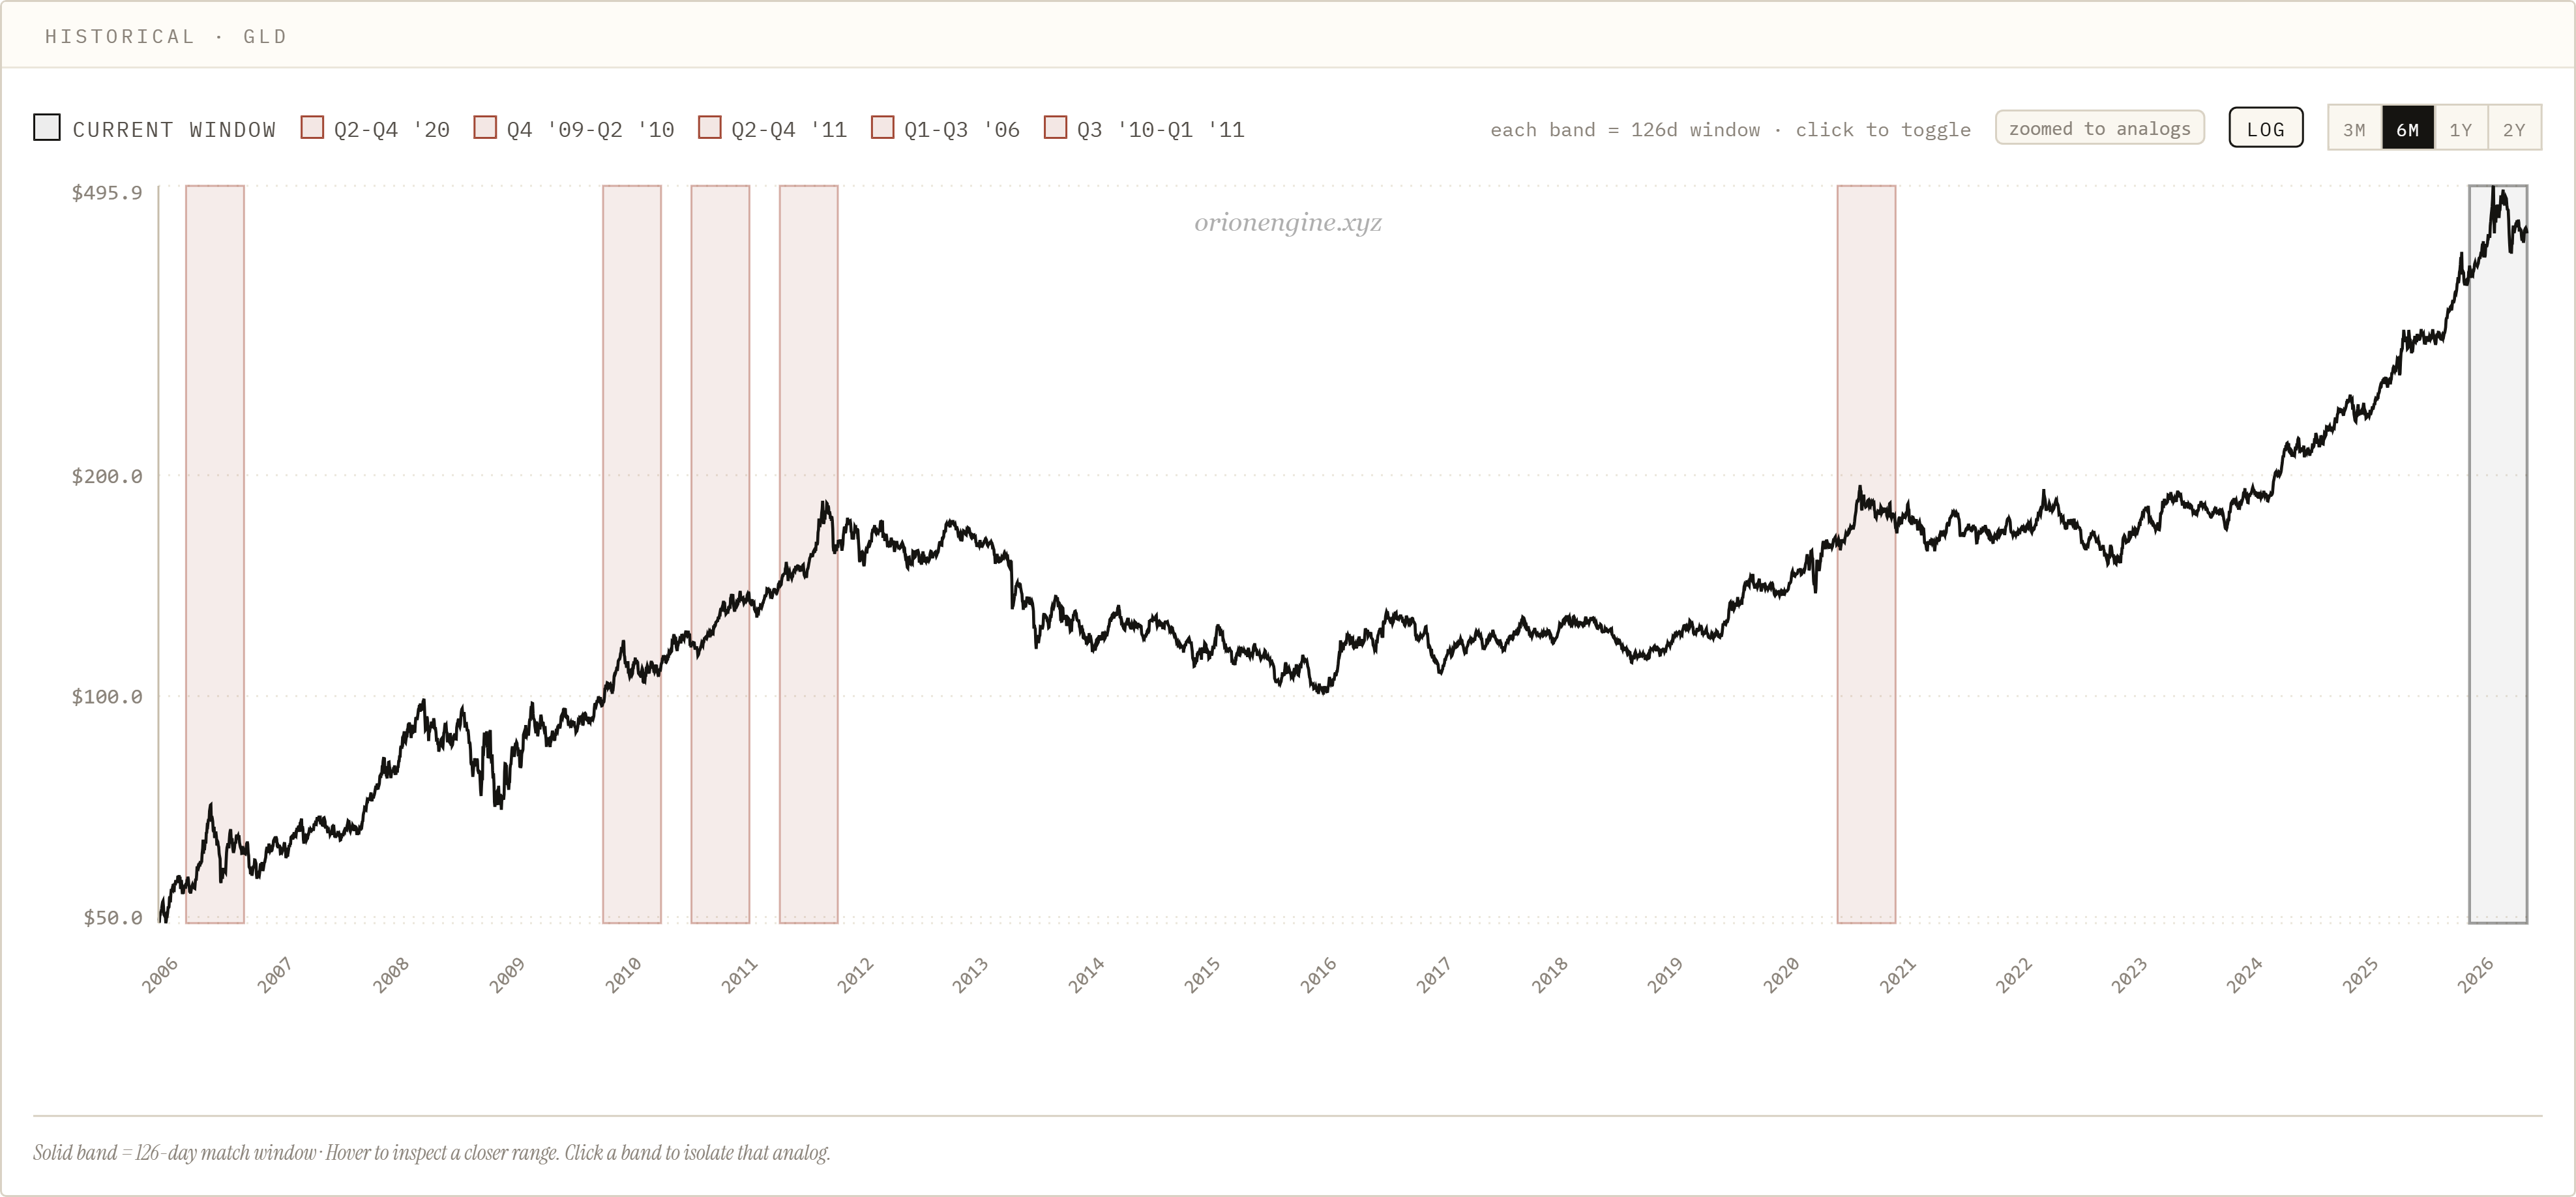
Gold is a slightly different case.
When an asset has already moved aggressively, the easy reaction is to call it overextended. That may be true in the short term, but with gold the larger question is whether the move is simply speculative excess, or whether the asset is catching up to a different monetary backdrop.
Higher structural deficits, persistent liquidity expansion, shifting rate expectations, central bank demand, and a broader loss of confidence in purely fiat reference points all matter here.
In that kind of environment, gold can move sharply not because the crowd has lost its mind, but because the old pricing framework was too low for the new regime.
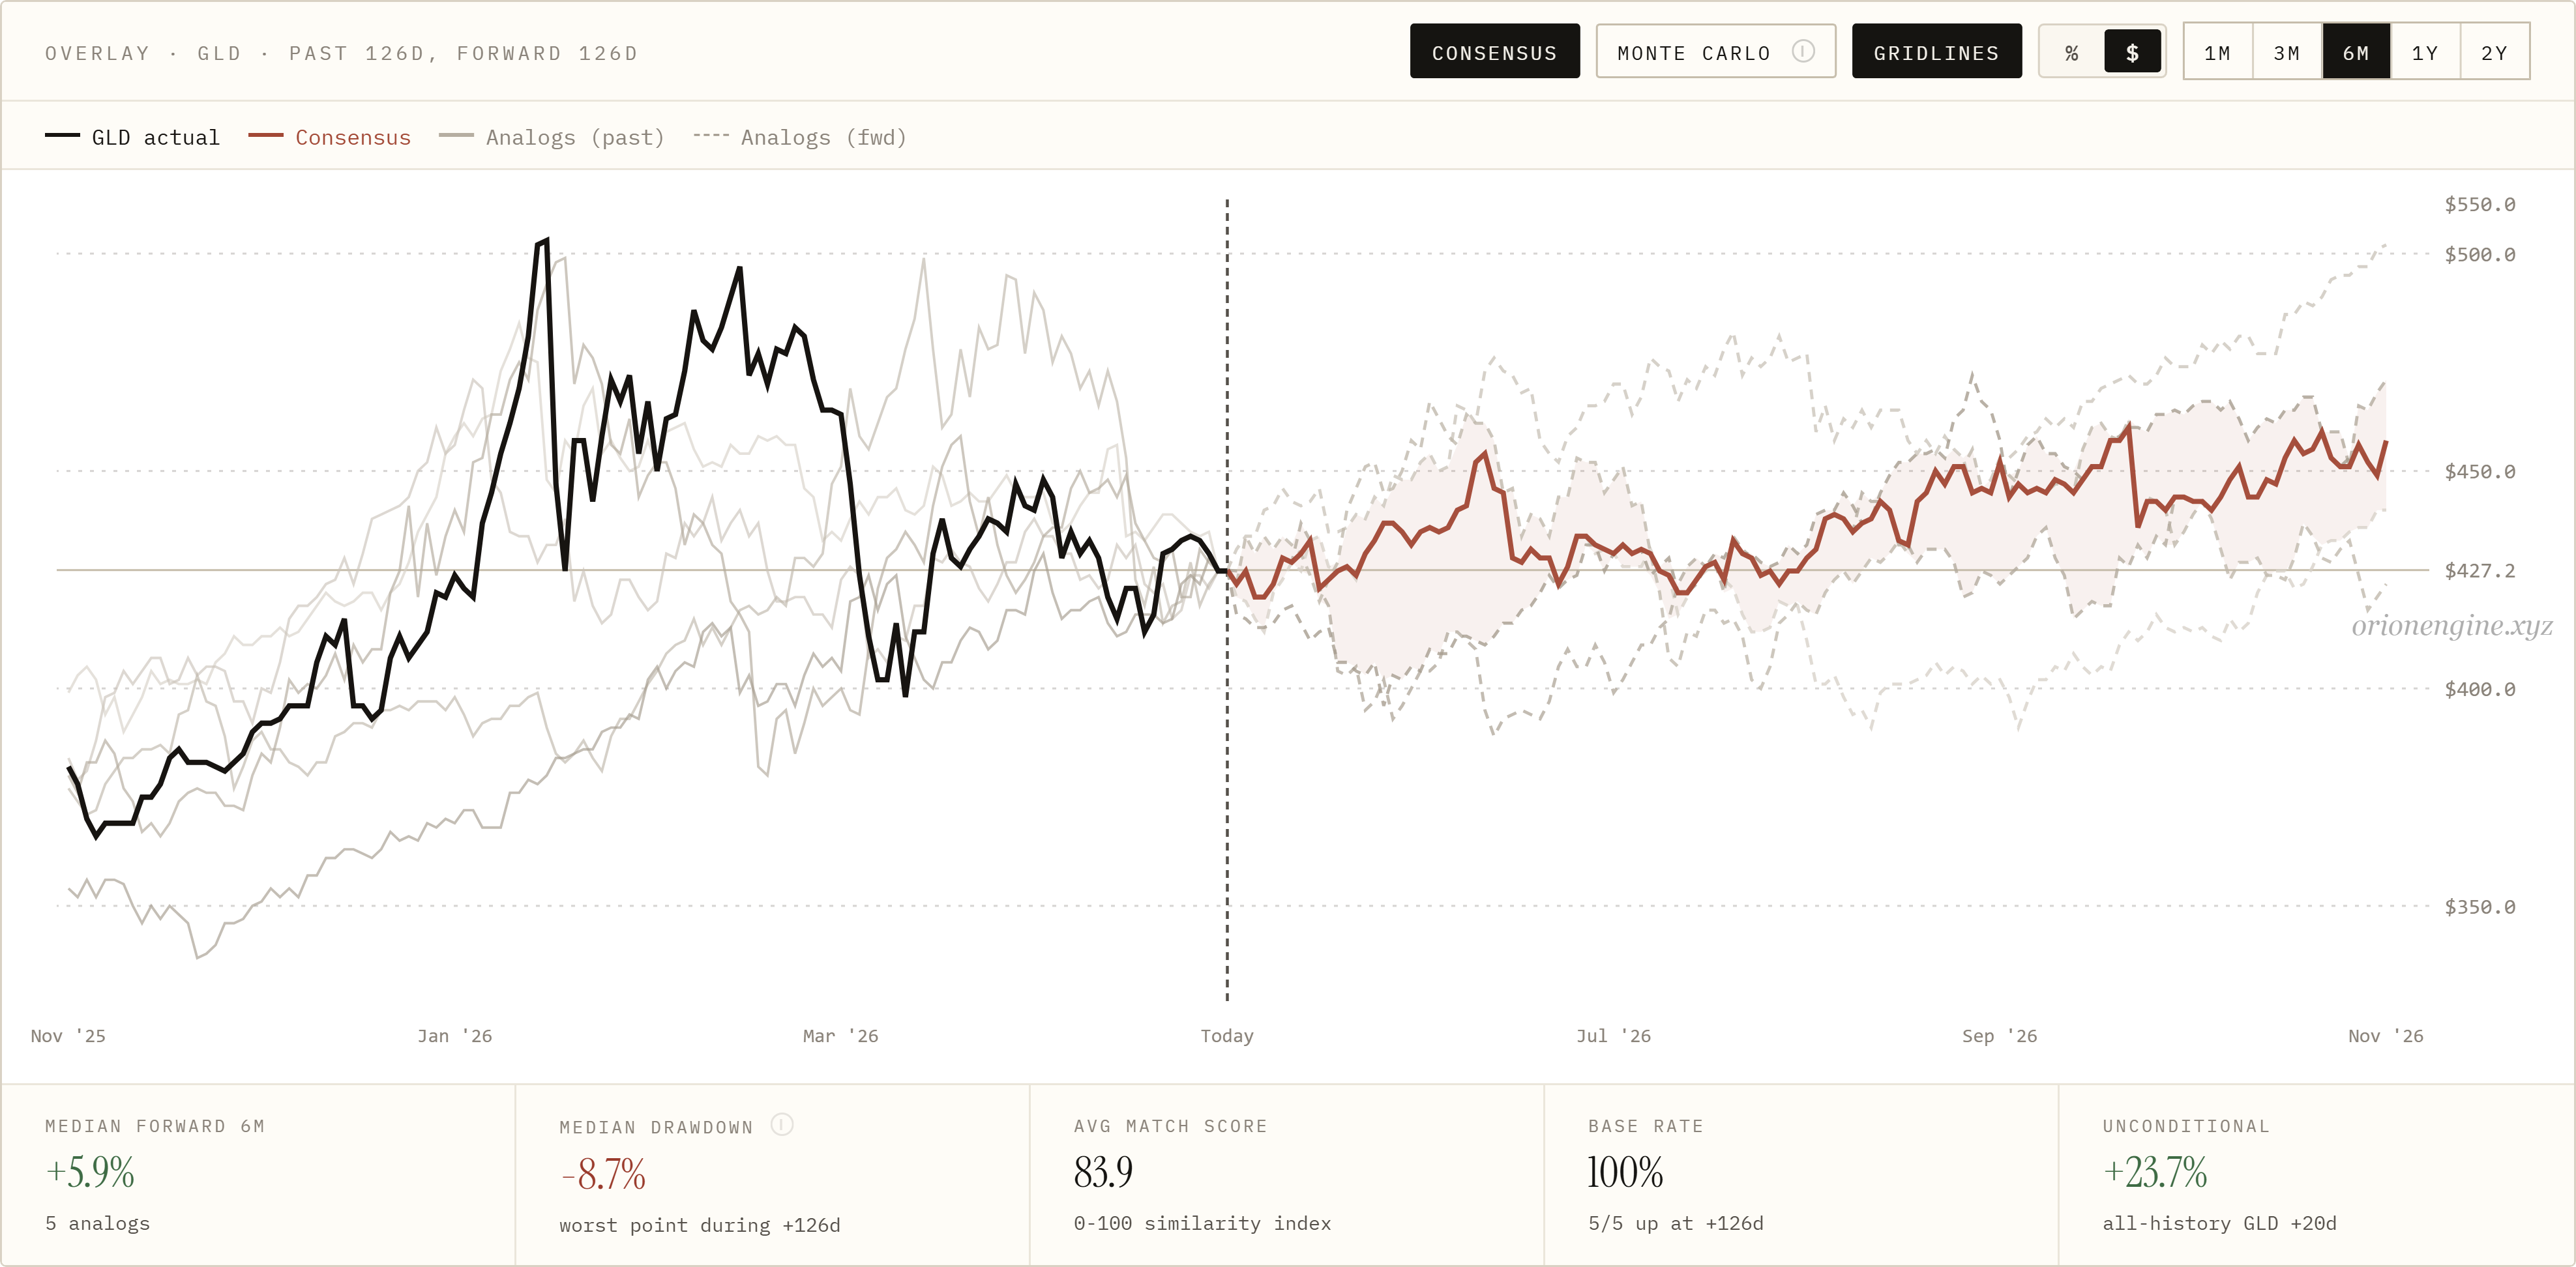
That does not mean the path has to be clean.
The historical analogs suggest that similar structures have tended to resolve positively, but drawdowns still occurred along the way. The forward path looked less like a straight-line continuation and more like a process of digestion after repricing.
That is the important distinction.
Consolidation after a major gold move does not automatically mean the thesis is broken. It may simply mean the asset has caught up to the new monetary regime and now needs time before the next catalyst appears.
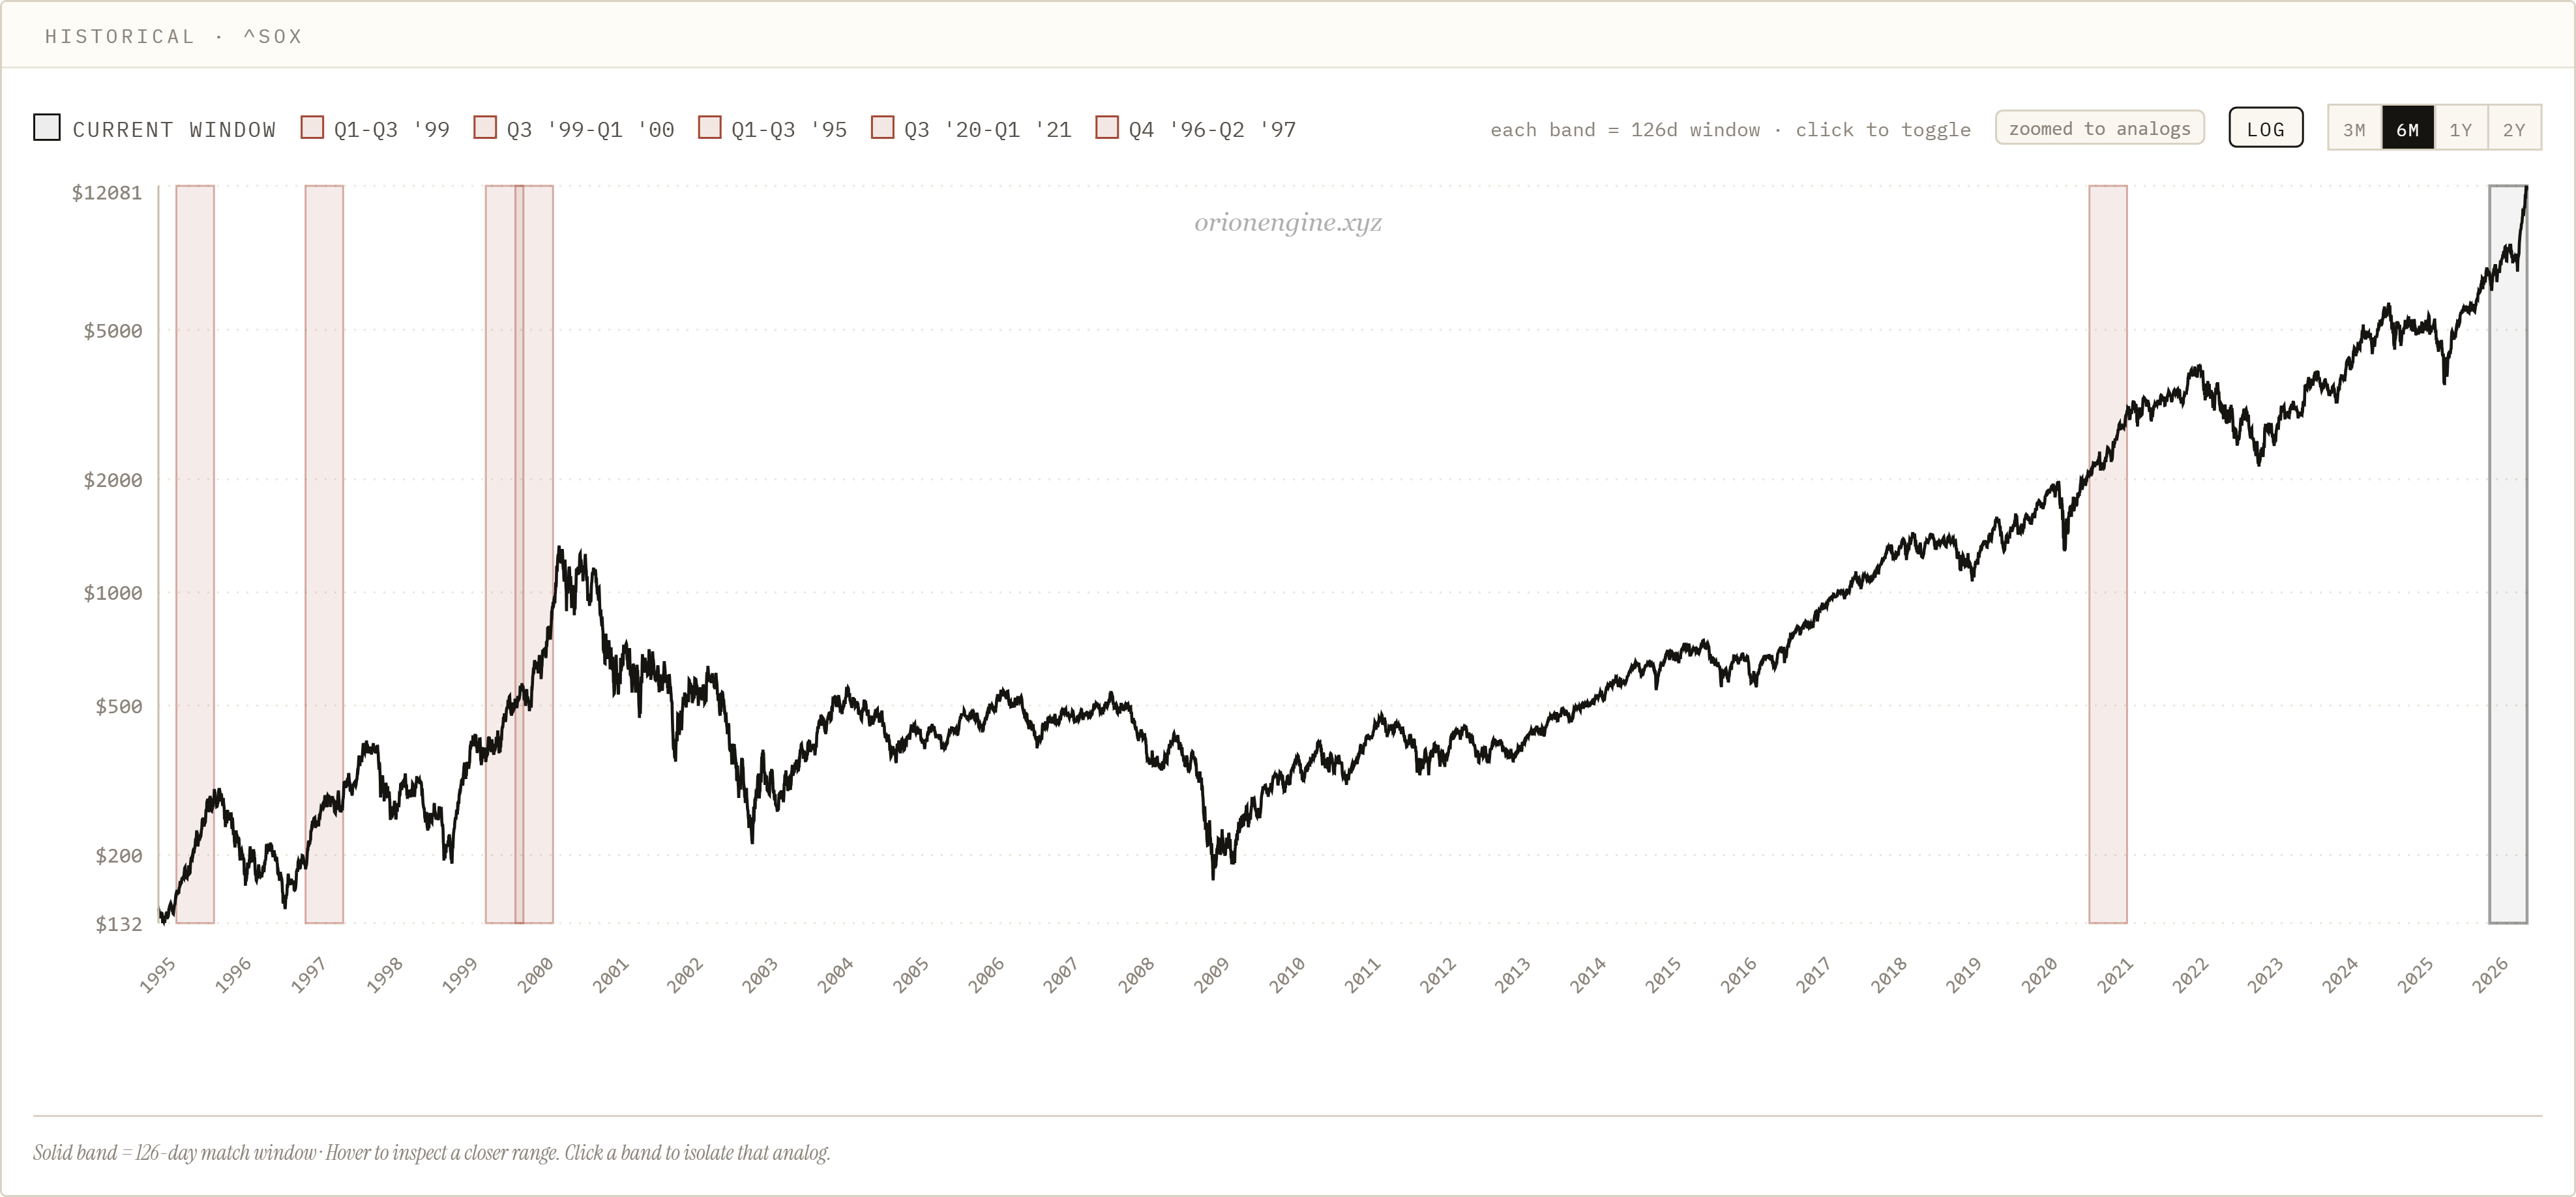
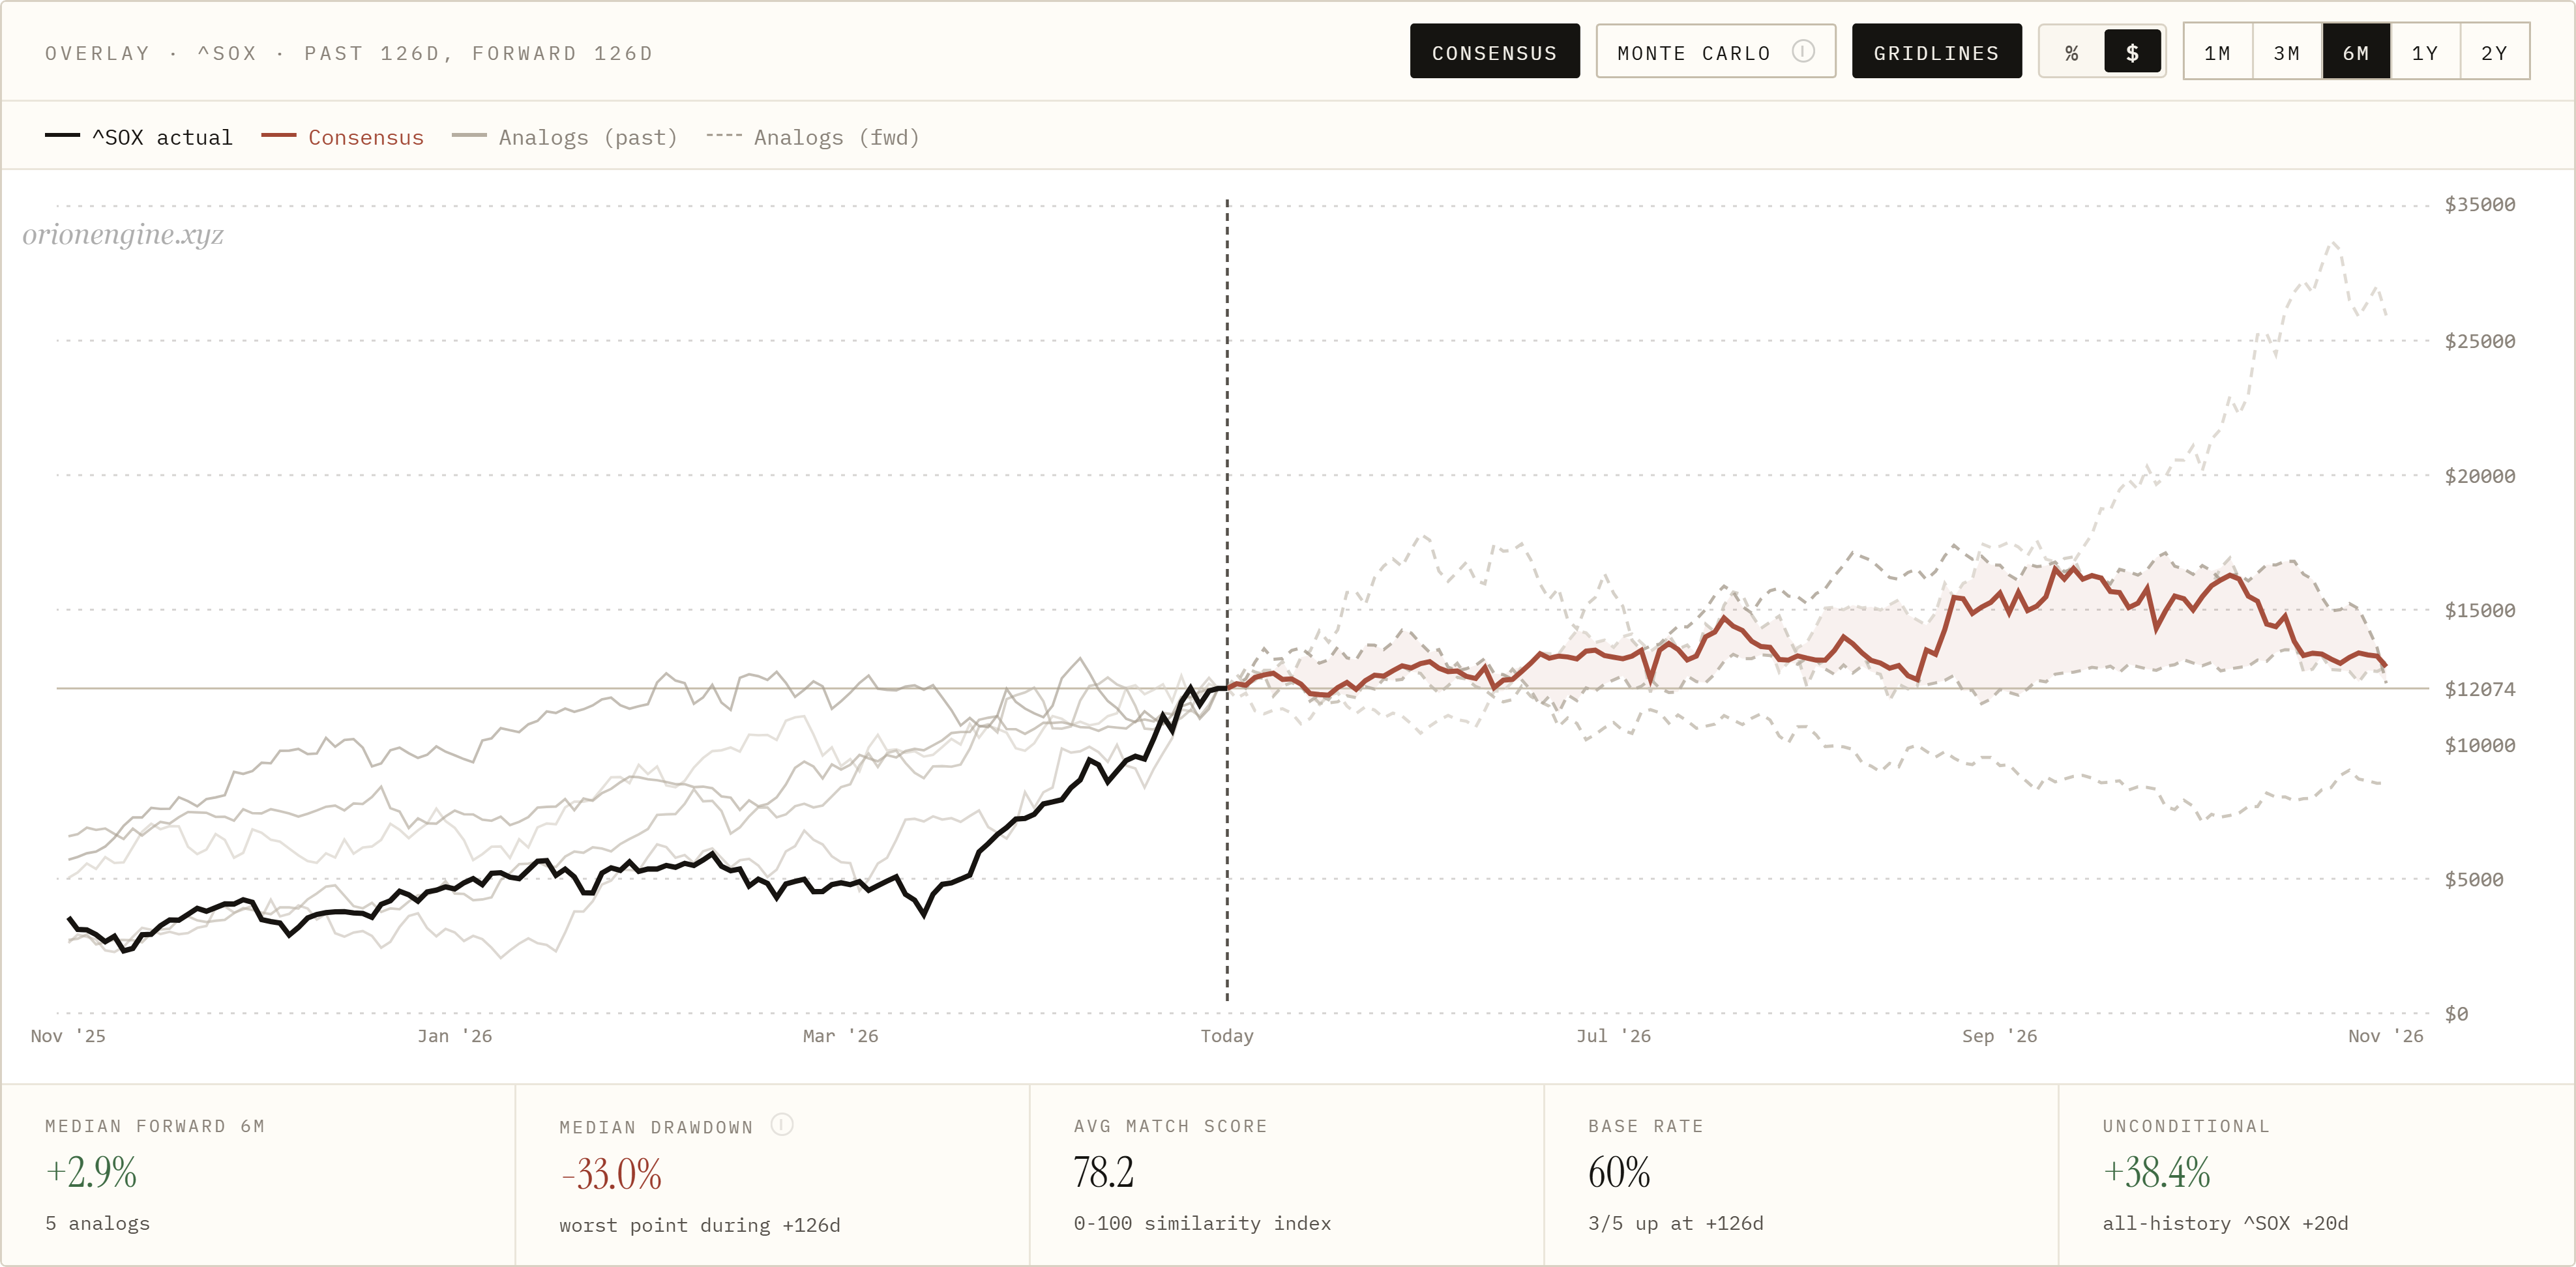
Semiconductors are probably the cleanest psychological case study.
When a sector is tied to a dominant market narrative, every move gets overinterpreted.
A rally becomes proof of a new era.
A pullback becomes proof the bubble is ending.
The problem is that both sides can become equally emotional. Bulls confuse narrative strength with unlimited upside. Bears confuse stretched conditions with immediate collapse.
But the market often lives between those extremes for longer than either side expects.
This is why I like using ORION as one of my tools.
Not as a signal machine.
Not as a replacement for judgment.
But as a way to slow down the decision process when emotion is loud.
Instead of asking, "What do I feel should happen next?" it lets me ask:
How often did similar structures keep rising?
How much drawdown happened first?
Was the forward path smooth or messy?
Did the setup usually reward chasing, fading, or waiting?
How different is the current move from the historical base rate?
Those questions are less exciting than a huge call spread or a dramatic crash thesis, but they are usually more useful.
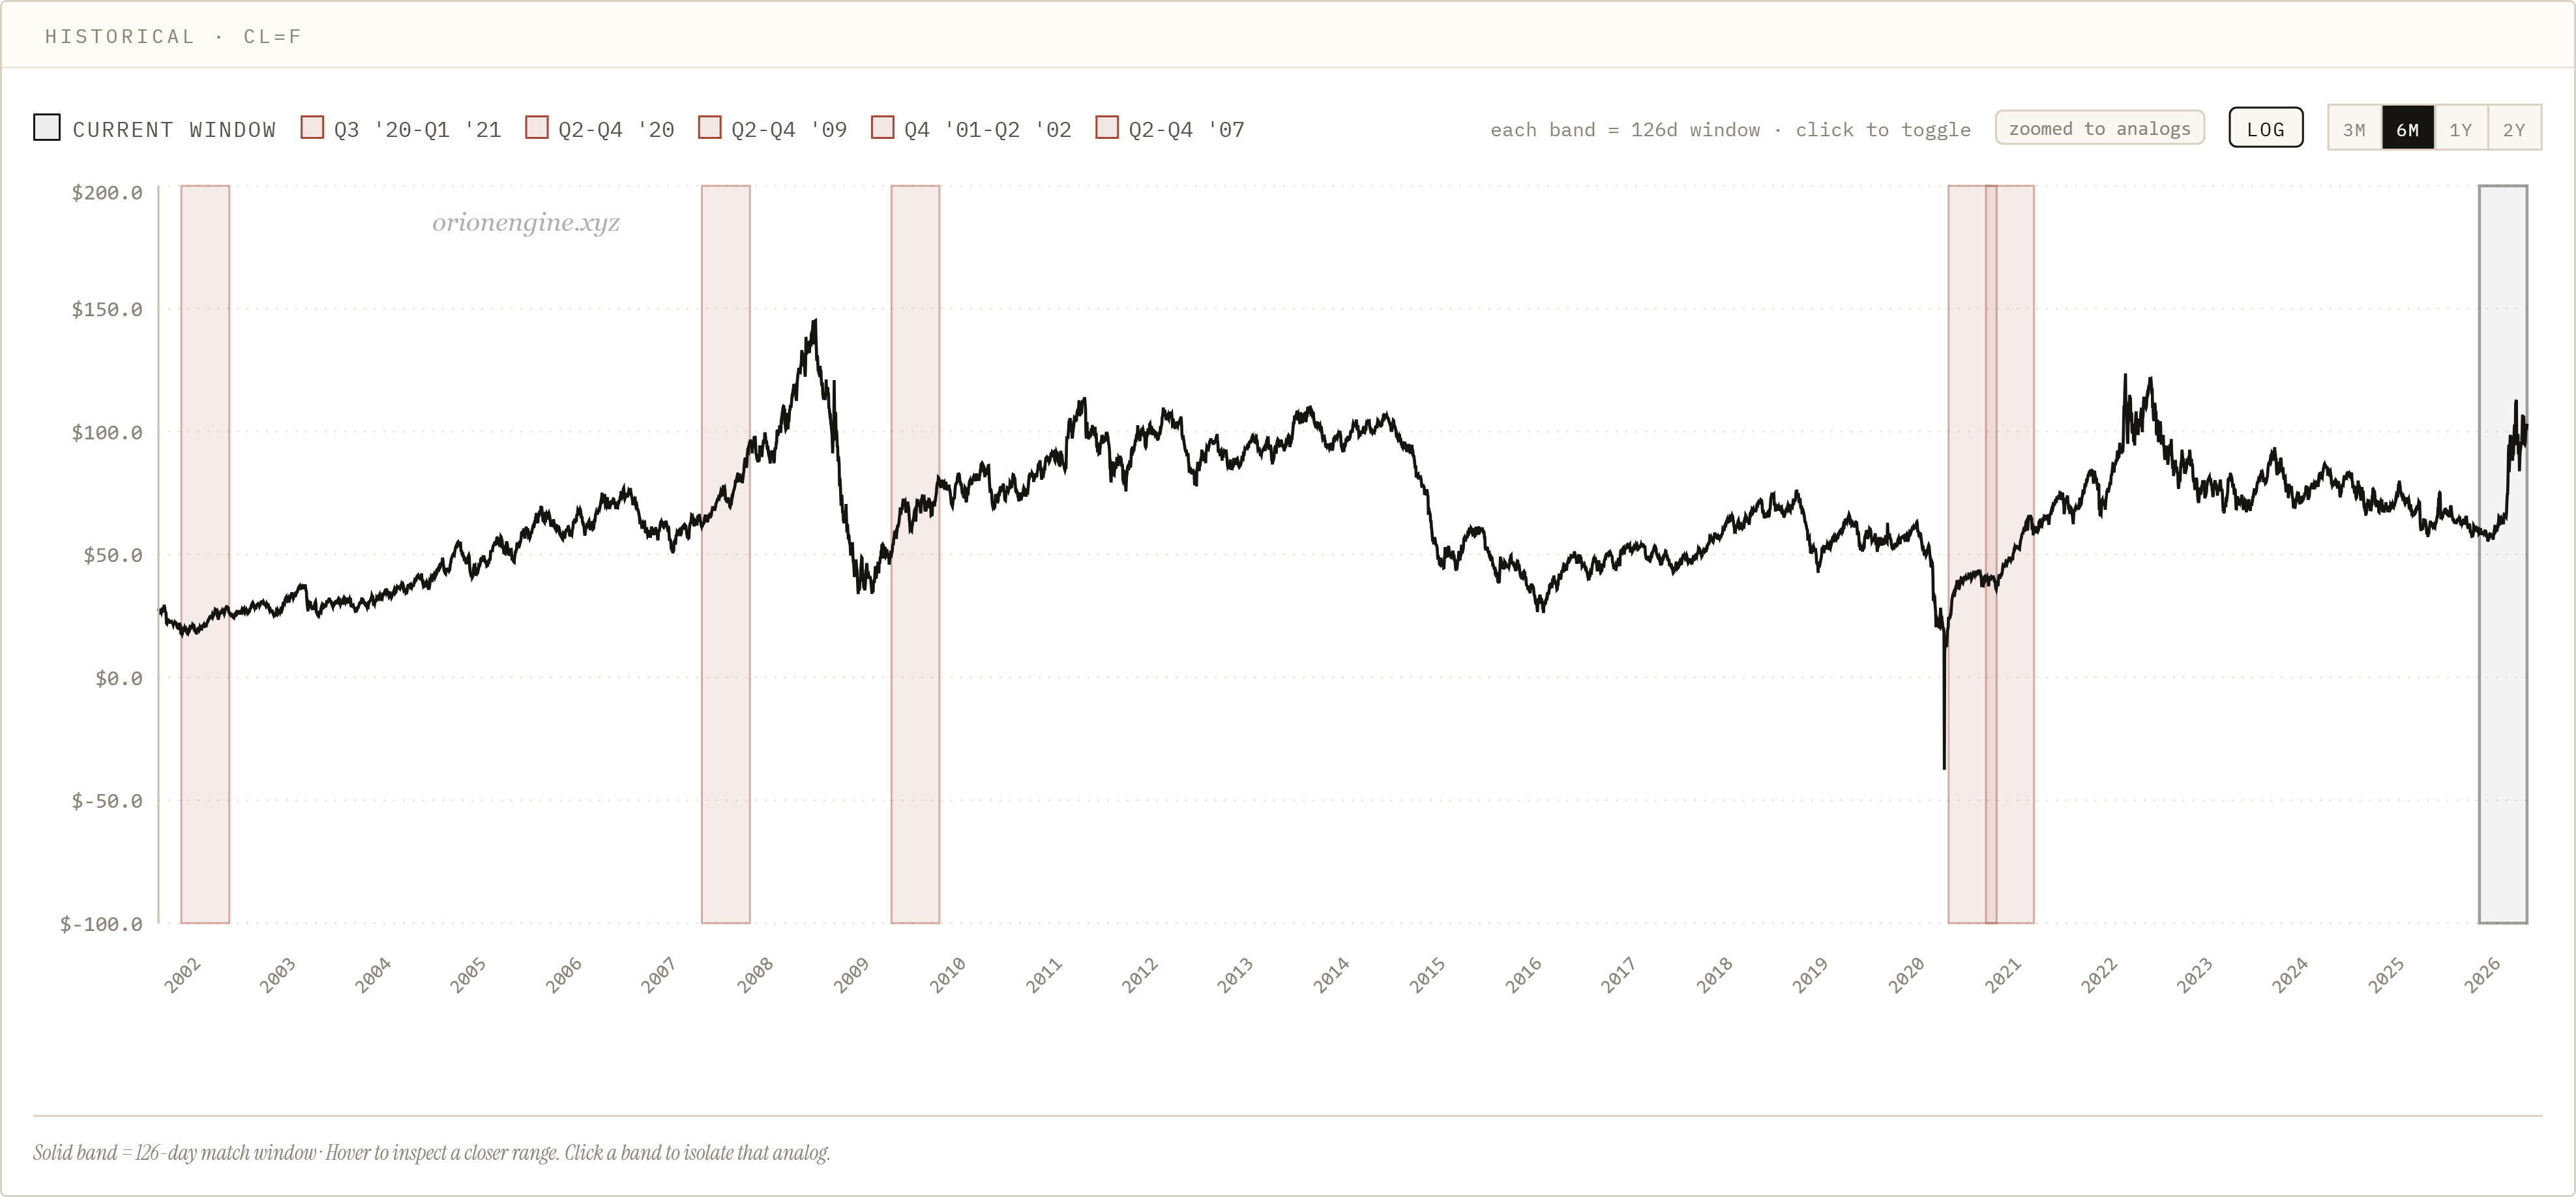
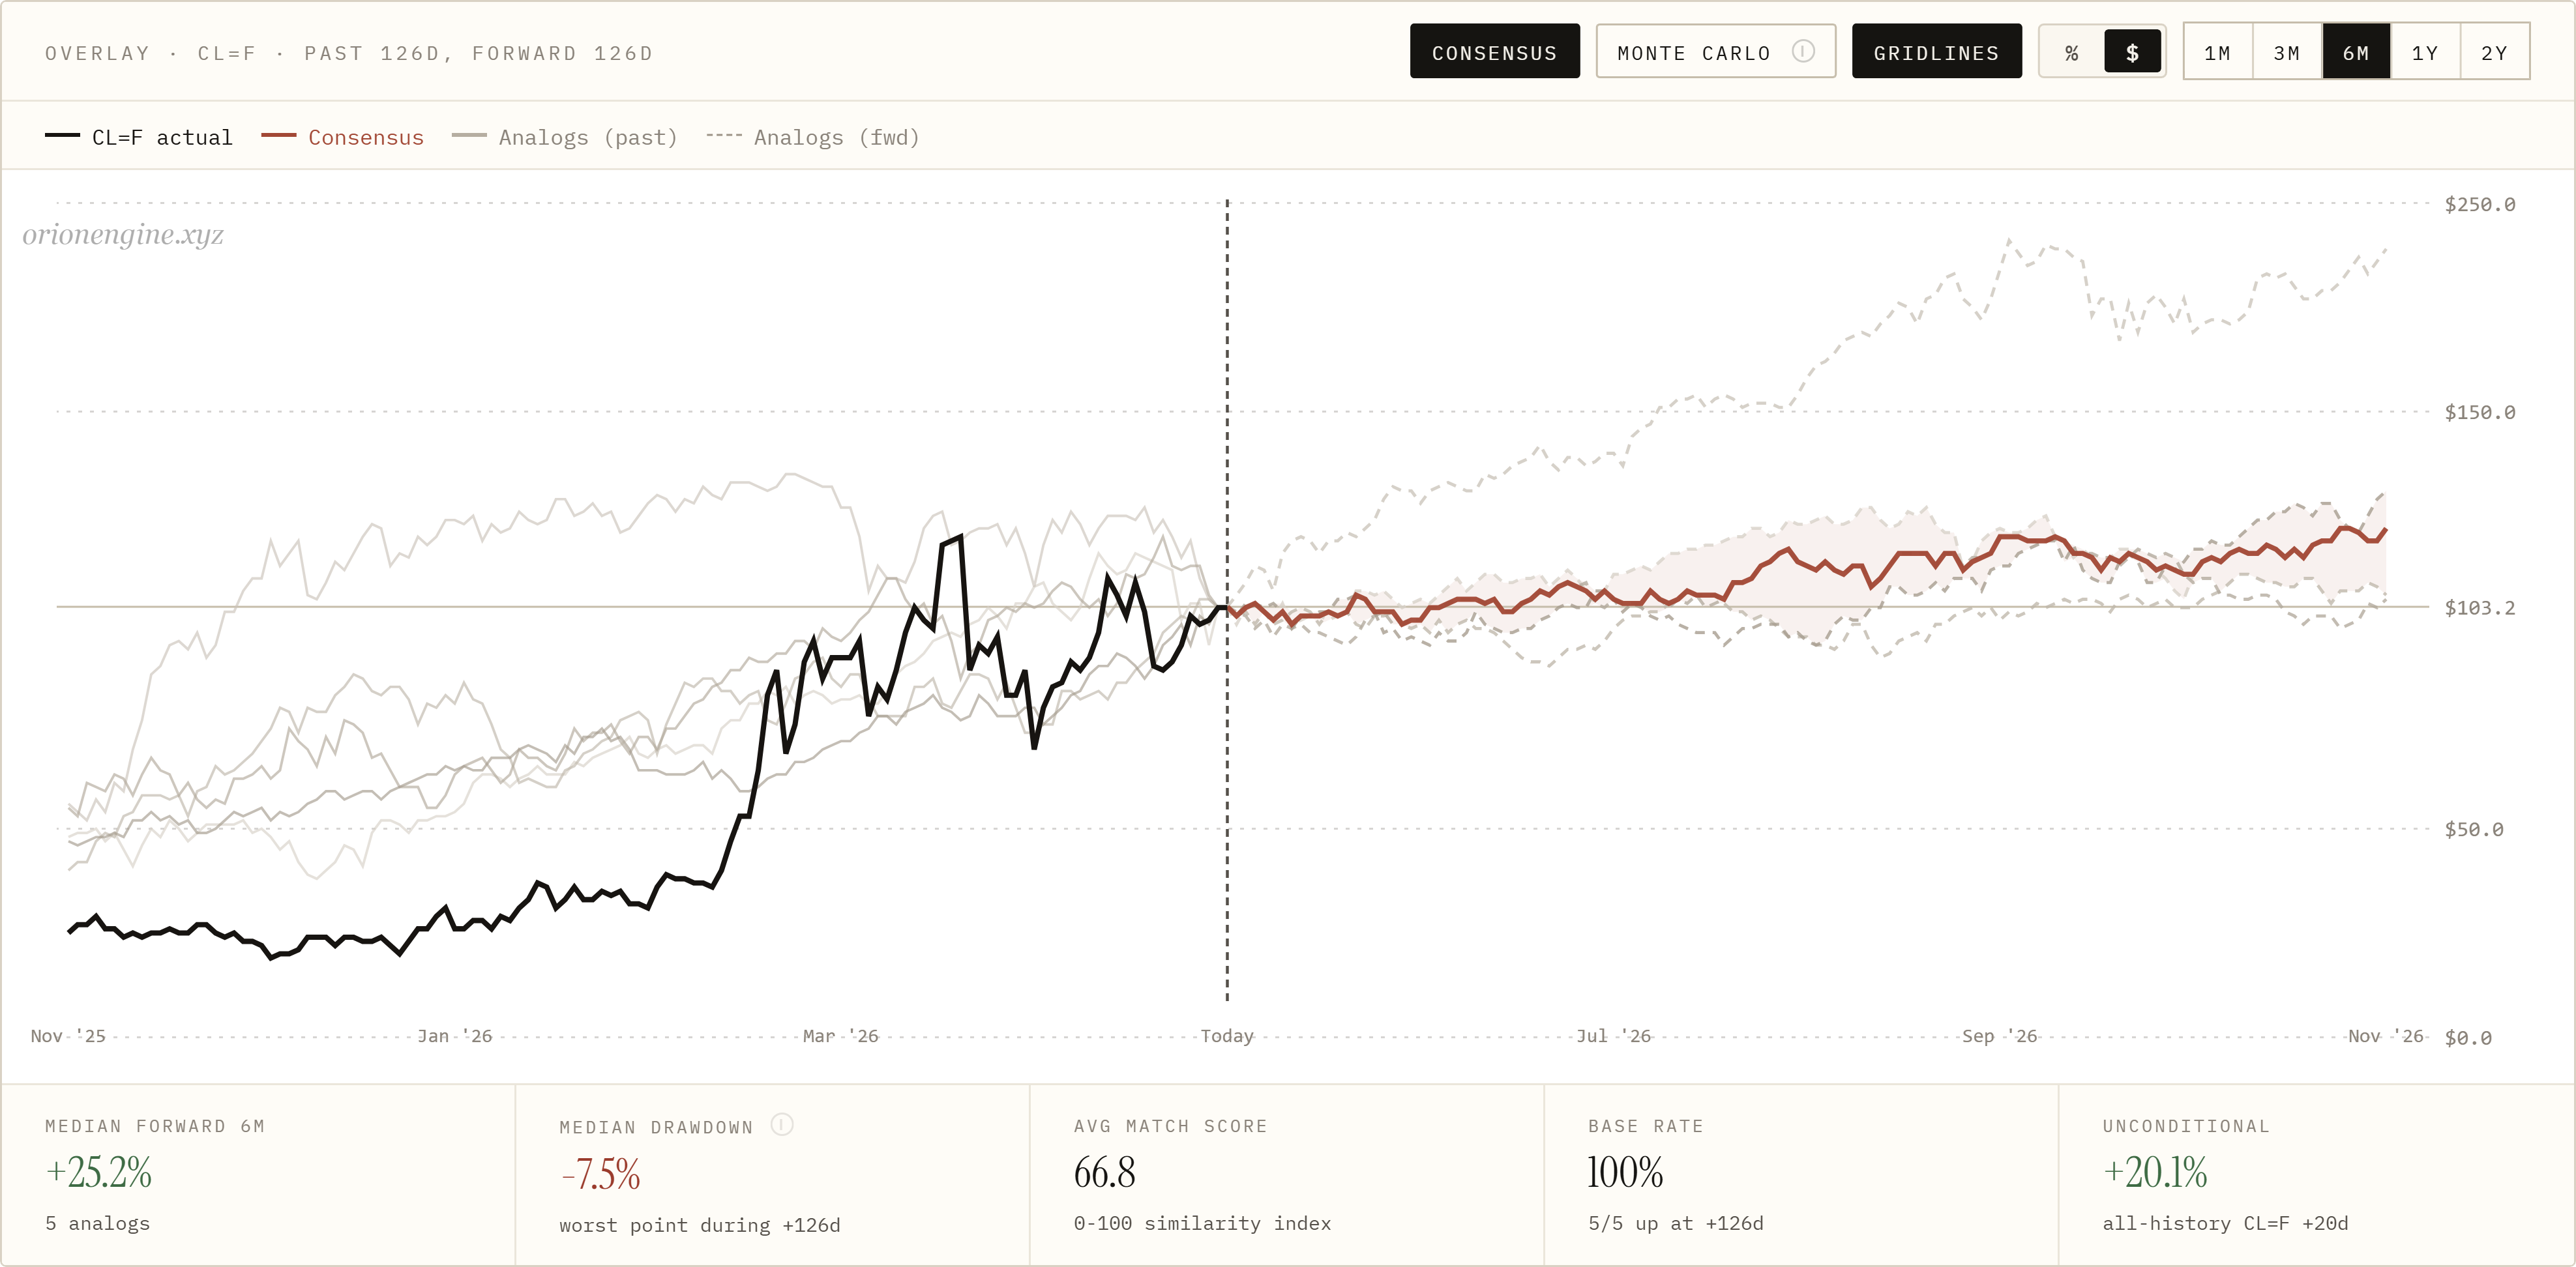
Oil is another example, though it needs to be treated more carefully because macro and geopolitical shocks can dominate the chart.
Still, the behavioral pattern is familiar.
After a violent move, people want a clean answer. Inflation trade. Recession trade. War premium. Supply shock. Demand destruction.
The chart becomes a battlefield for narratives.
But even there, historical analogs can help separate the emotional residue of the move from the actual structure of the market.
The broader lesson across these examples is not that every asset is bullish or bearish.
That would be too simplistic.
The lesson is that extreme recent movement tends to distort expectations.
People see volatility and immediately convert it into direction. They assume that because something moved hard, the next move must also be hard. They look for the continuation trade or the reversal trade, while the market often does something more frustrating and more probable: it digests.
That digestion phase is where many traders lose patience.
They overtrade.
They over-hedge.
They buy options with bad timing.
They short strength too early.
They chase after the easy part of the move has already happened.
And most of the time, they are not reacting to the market itself. They are reacting to how the last move made them feel.
That is the real value of historical analog work.
It gives you a way to ground sentiment before it turns into a decision.
It does not eliminate uncertainty. It does not guarantee that the past will repeat. It does not give you permission to stop thinking.
But it does give you context.
And in markets, context is often the difference between having a view and just having an emotional reaction with a chart attached to it.