 ORION
ORION
HISTORICAL SPY
2009–2026 VIEWORION
Market history made searchable.
Search a ticker, explore its closest historical matches, and see what followed.
Explore market historyONE SEARCH · FIVE CONNECTED SECTIONSDATED PRODUCTION READ · AS OF SEP 8, 2026
One question. The complete historical read.
One search opens Historical, Overlay, Macro, Outcomes and Seasonality.
OVERLAY SPY
5 REAL ANALOGSMatch the past. See what followed.
CURRENT WINDOWHISTORICAL MATCHESWEIGHTED CONSENSUS
MEDIAN AT +20 SESSIONS0.7%same five matchesMATCHES FINISHING UP3 / 5historical frequencyLOWEST AT +20 SESSIONS-2.9%HIGHEST AT +20 SESSIONS6.7%
MACRO SPY
REGIME CONTEXTCheck whether the backdrop agrees.
DXY DOLLAR INDEX98.8 PCTL 21
Weak USD
Gold/Copper RISK APPETITE9.85 PCTL 58
Neutral
Oil COMMODITY TAPE146.0 PCTL 99
Oil elevated
2s10s CURVE SPREAD0.41 PCTL 34
Flat
OUTCOMES SPY
5 ANALOGSSee what happened next, each time.
ANALOG WINDOWSCORE+20D+1Y+2Y
Q4 '12–Q2 '13range-bound · low vol · near highs92.4+6.7%+26.0%+38.9%
Q4 '13–Q2 '14range-bound · low vol · near highs92.3+1.3%+15.0%+15.2%
Q1 '21–Q3 '21range-bound · moderate vol · near highs91.4+0.7%−2.7%+2.7%
Q4 '10–Q2 '11range-bound · low vol · near highs91.4−2.9%+2.2%+30.8%
Q1 '23–Q3 '23range-bound · moderate vol · near highs · risk-off macro91.0−1.1%+30.1%+52.5%
AVERAGE OF 5across the analogs above—+0.9%+14.1%+28.0%
SEASONALITY SPY
33Y SAMPLEPut the ticker inside its calendar history.
GO DEEPERPRO TOOLKIT · FIVE SPECIALIST TOOLS
When the question changes, go deeper.
Pro tools to test a rule, inspect a catalyst, compare markets, and scan the close.
SPY: short-term volatility unusually low, with today's and the one-month moves subdued.
TUE - SEP 08GME earningsSCHEDULEDCALENDAR
THU - SEP 10ADBE earnings + ORCL earningsSCHEDULEDCALENDAR
FRI - SEP 11US Core CPI + US CPI8:30 AM ETOFFICIAL
SPYCL=F
Same-day r 0.05; latest 90d r -0.39.
AS OF SEP 8, 2026
CURRENT TICKERCLOSEST HISTORICAL SHAPE
GC=F
252 sessions · 5 historical matches · as of SEP 8, 2026
BTC-USD
126 sessions · 5 historical matches · as of SEP 8, 2026
DATED SCAN · SEP 9, 2026146 TICKERS SCREENED
TICKER / LOOKBACKMATCHVS BASELINE
DIA · 1Mrange-bound · low vol · near highs89.3+7.4%LONG / 126D
CVX · 1Muptrend · moderate vol · near highs89.2+1.8%SHORT / 21D
LOW · 3Mdowntrend · moderate vol · mid-range89.2+3.4%LONG / 126D
HD · 6Mdowntrend · moderate vol · mid-range88.9+1.0%SHORT / 21D
Edge vs. ticker baseline · Score = similarity
ProFree opens a useful first result. Pro unlocks every result, unlimited reads, saved work, alerts, and exports.Explore the tools
THE PREMISE
Every market feels unprecedented. Almost none are.
SILVER · 2000–2026 · TODAY’S WINDOW, MATCHED AGAINST REAL HISTORY
WATCHLISTSAVED WORKSPACE
Keep the setups worth coming back to.
Keep the original read. Follow what actually happens.
YOUR WATCHLIST · MSTRSAVED AUG 20, 2026 · SHARED SEP 17, 2026
EXPECTED AT DAY 18+18.3%
ACTUAL AT DAY 18+12.3%
DIFFERENCE−6.0 pp
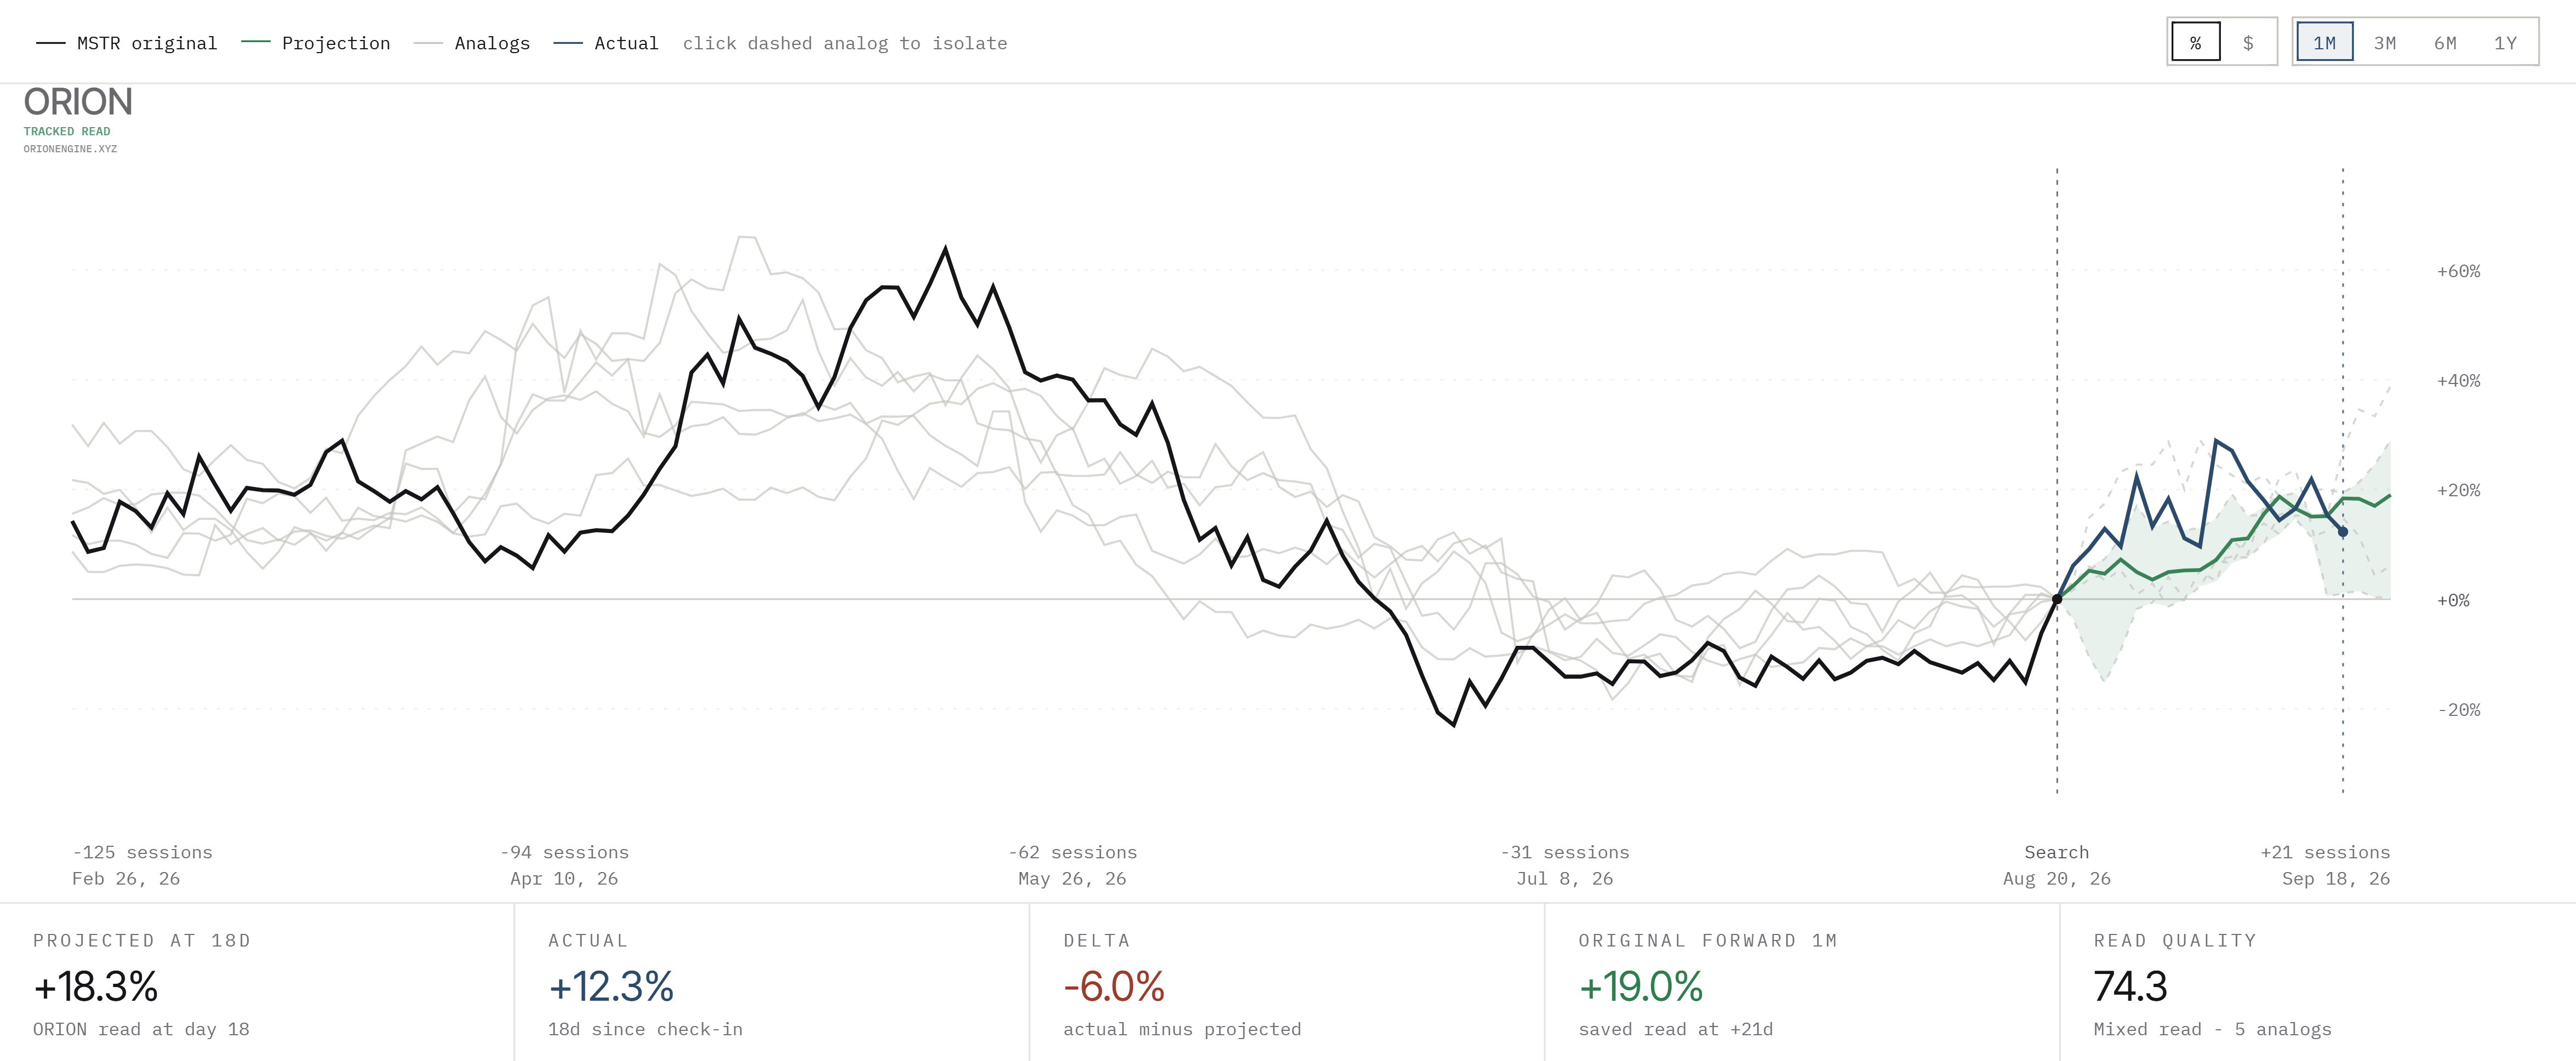
One tracked example · Historical analogs are not guarantees.Open watchlist →
PRICING
Priced for the everyday investor.
The full engine is $19 a month — no terminal, no seat license, no sales call.
Free
$0
FOREVER
Explore every research surface with a focused daily limit.
- 1 complete ticker read per day
- 1 complete Pro-tool test per day
- One continuous five-section ticker read
- Up to 5 analogs with full evidence
- Revisit completed work without charge
Most popular
Pro
$19/ MONTH
BILLED MONTHLY · CANCEL BEFORE RENEWAL
The full personal research workflow.
- Everything in Free
- Unlimited standard research
- Up to 10 analogs
- Full depth across all five deeper tools
- Saved reads, alerts, exports, and digests
Institutional
$99/ MO
OR $999 / YEAR
For PMs, research desks, and client work.
- Everything in Pro
- PDF research memos
- API access & CSV exports
- Monte Carlo probabilistic paths
- Priority onboarding